School-Based Police Contact Data Analysis
Breaking Down Charges
Analyzing the collected school-based police contact data self-reported by districts in response to FOIA requests. The goal is to understand the police contact rate of districts, the influence of legislation on trends in charges, what charges are being pressed against students, and the profile of who is being charged. When responsive documents are received, data is reviewed, cleaned, and stored in a master database. The data will be continuously updated as more Public Records Requests (PRRs) are filed and responsive documents are received. We have filed over 300 Public Records Requests (PRRs) and received complete and useful data from about 80 districts, we received documents from other districts which reported 0 arrests
Data Visualization Methodology
The visualizations on this page include school-based police contact data for students aged 5–18. The data presented covers all categories of police interactions provided by the districts, including summonses, referrals, complaints, and arrests.
Districts providing comprehensive school-based police contact data include:
Acton, Boston, Bridgewater, Brockton, Cambridge, Chicopee, Everett, Fall River, Fitchburg, Framingham, Haverhill, Holyoke, Lawrence, Lowell, Lynn, Malden, Methuen, Plymouth, Quincy, Revere, Somerville, Southbridge, Taunton, Waltham, Springfield, Acushnet, Agawam, Andover, Ashburnham, Auburn, Leominster, Natick, Needham, Peabody, Wachusett, Weymouth, Amesbury, Clinton, Danvers, Dennis, Dighton, Dudley, Duxbury, Easton, Edgartown, Georgetown, Gloucester, Groton, Halifax, Hatfield, Lakeville, Manchester, Melrose, Middleborough, Nantucket, Northampton, Norwood, Oxford, Pentucket, Rockport, Sharon, Scituate, Saugus, Provincetown, Ludlow, Longmeadow, Lenox, Kingston, Hudson, Holbrook, Belchertown, Boylston, Carlisle, Carver, Eastham, Hadley, Harvard, Hanover, Bedford, and Rochester.
Of these 80 districts, 76 were analyzed following data cleaning to ensure accuracy regarding the specified age group (5–18 years).
Please note: districts did not provide unique student identifiers, making it impossible to determine if individual students experienced multiple police interactions. Consequently, each incident is counted separately, potentially affecting overall arrest rates. For improved accuracy and transparency, districts are encouraged to provide unique identifiers to enable tracking and better represent student experiences with law enforcement.
Percentage Based on Student Enrollment
Preschool-Grade 12
As illustrated in the map visualization above, districts highlighted in orange represent those with the most complete data on school-based police interactions. By hovering over each district, you can view detailed information, including the total number of police interactions and student enrollment figures. Additionally, the "category of police contact" provides insight into how police interactions with students have been categorized
Total Police interactions per District
This bill amends the Controlled Substances Act and the Controlled Substances Import and Export Act to reduce from 20 to 15 years and from life to 25 years the mandatory minimum prison terms for certain nonviolent repeat drug offenses.
Trends of Charges
Influential Legislation
2014-2018
Sentencing Reform Act 2015
Criminal Justice Reform Act 2018
“Bias-free policing” shall mean decisions made by law enforcement officers that shall not consider a person’s race, ethnicity, sex, gender identity, sexual orientation, religion, mental or physical disability, immigration status, or socioeconomic or professional level.
School Resource Officers 2014
Massachusetts adopted the school police requirement in 2014. A School Resource Officer (SRO) is a duly sworn municipal police officer. SROs theoretically promote school safety and security services to elementary and secondary public schools and maintain a positive school climate.
The Impact of COVID-19
The number of police interactions reported during the years 2020-2021 decreased due to the COVID-19 pandemic that forced students to participate in online learning outside of school.
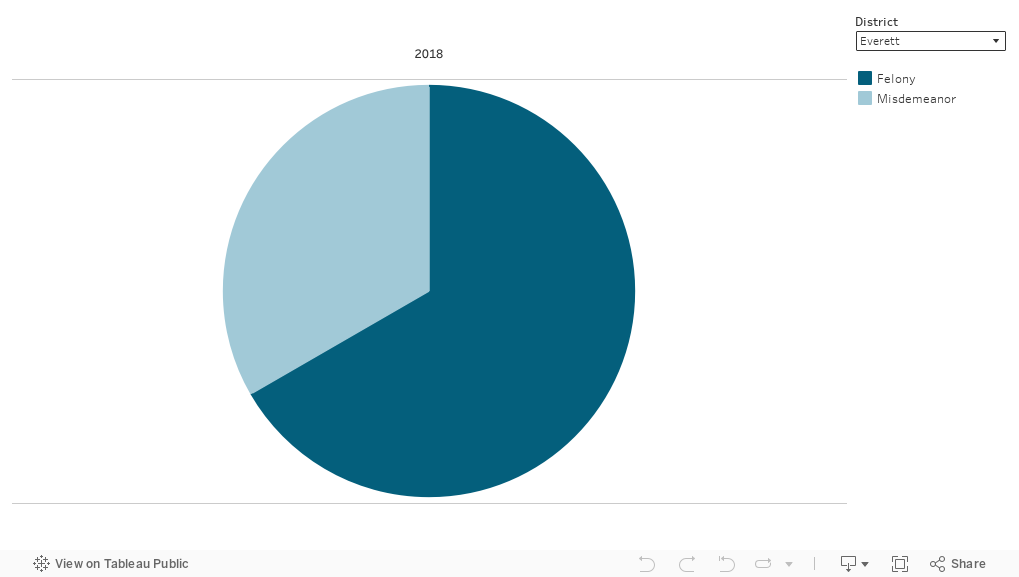
Charge Trends
2018-2023
Analysis of school-based police interactions across districts reveals distinct trends in charges filed before and after the COVID-19 pandemic. Notably, misdemeanor charges were the most frequent type of offense during both periods, exceeding felony, other, and unknown charge categories. The visualizations below clearly illustrate the total number of interactions categorized by felony, misdemeanor, other, and unknown charges. Users can explore the interactive graph by hovering over individual bars to view exact counts and gain deeper insight into these charge categories. This detailed breakdown aids in understanding trends in student-police interactions and highlights areas requiring further examination or intervention.
Defining Charges
A crime punishable by death or imprisonment in the state prison is a felony. All other crimes are misdemeanors.
Other
A charge is categorized as other when it does not match any entry within the Felony and Misdemeanor Master Crime List referenced by Massachusetts General Law (M.G.L.). This designation indicates that the specific charge could not be clearly identified or aligned with the standardized categories provided in the master list.
What is the difference between a Felony, Misdemeanor, Other and Unknown charge?
Felony
Misdemeanor
In Massachusetts, a misdemeanor is any criminal offense that does not carry the potential for state prison time. The maximum sentence for a misdemeanor is 2 1/2 years in the House of Corrections, which is a jail.
Unknown
A charge is categorized as unknown when the data provided does not specify or list a particular charge. This indicates an absence of detailed charge information within the dataset.
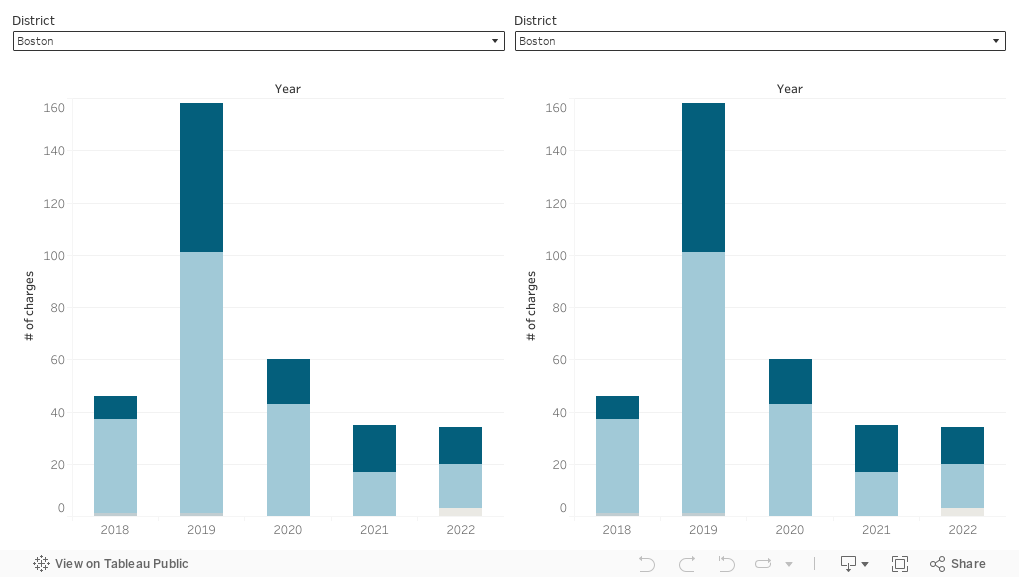
Charges Across Districts Comparison
2018-2023
Types of Charges by District
2018-2023
The visualization below allows for an interactive comparison of felony and misdemeanor charges across districts. Take a moment to explore the data by interacting with the visual to see how charges vary between districts. Choose two districts to view detailed comparisons and gain deeper insights into regional trends and differences. The visual is also filtered for the type of police contact at schools
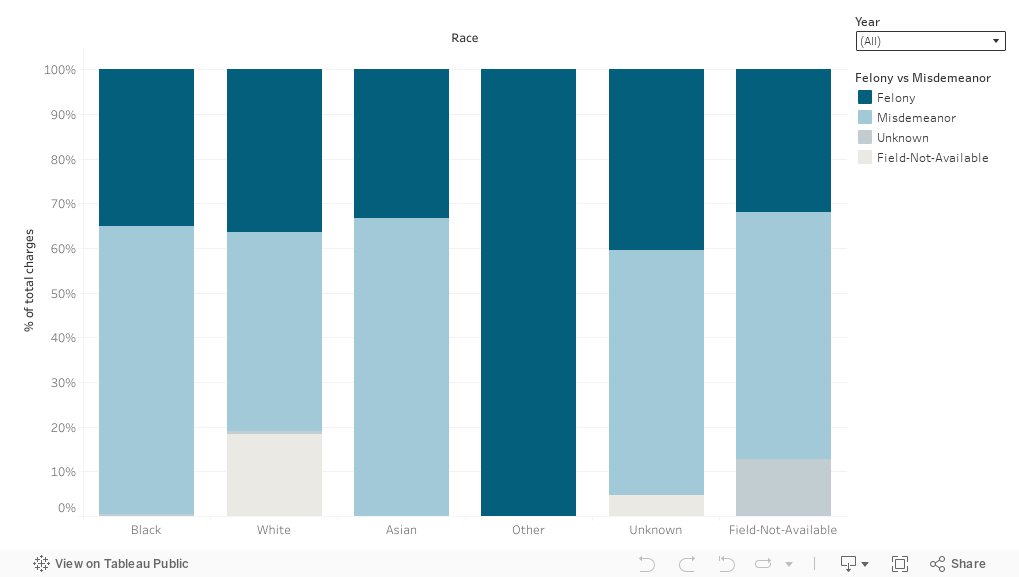
Understanding who is being charged with a crime in relation to racial or ethnic groups is important to identify inequities that occur in each district will identify discriminatory treatment or poor data collection practices.
Arrests by Offense & Race 2018-2022
Race & Ethnicity
Racial & Ethnic Disparity
Race:
American Indian or Alaska Native: A person having origins in any of the original peoples of North and South America (including Central America), and who maintains tribal affiliation or community attachment.
Asian: A person having origins in any of the original peoples of the Far East, Southeast Asia, or the Indian subcontinent including, for example, Cambodia, China, India, Japan, Korea, Malaysia, Pakistan, the Philippine Islands, Thailand, and Vietnam.
Black or African American: A person having origins in any of the black racial groups of Africa.
Native Hawaiian or Other Pacific Islander: A person having origins in any of the original peoples of Hawaii, Guam, Samoa, or other Pacific Islands.
White: A person having origins in any of the original peoples of Europe, the Middle East, or North Africa.
Middle eastern: A person having origins in any of the original peoples of the Middle east, Qatar, UAE, Syria, Turkey.
Field not found: When the requested race data is not provided by the police department.
Unknown: When the race is reported as unknown on the data provided by the police departments.
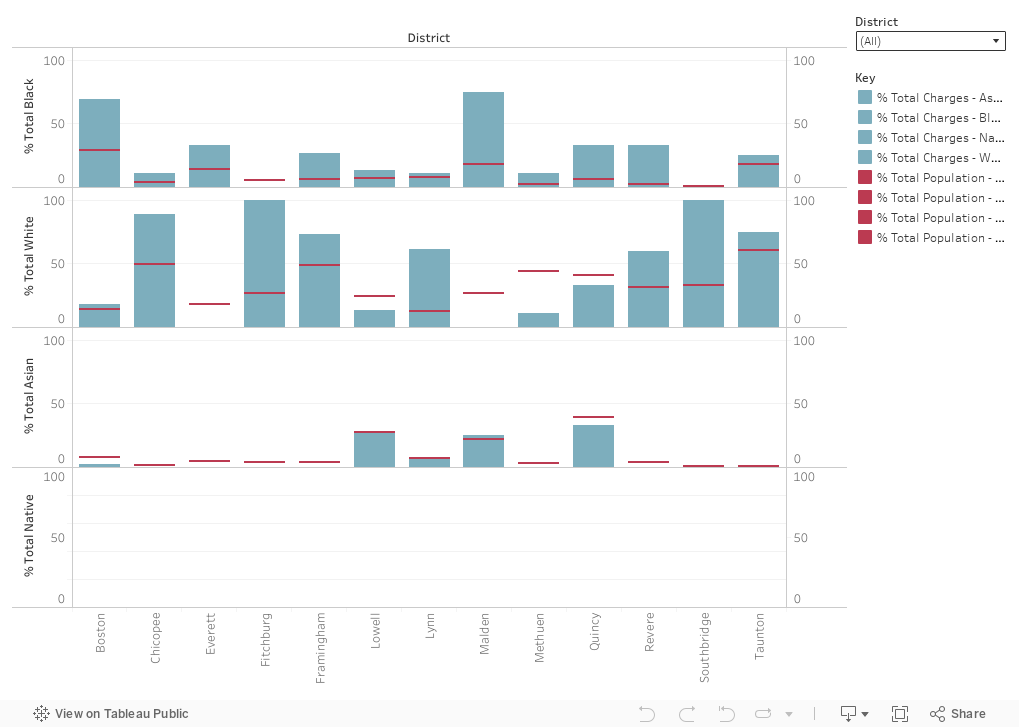
Racial Disproportionality Rates 2018-2022
Calculating the ratio of the percent of a specific racial group’s base population in comparison to their police interaction percentage. Police interaction percentage is divided by the base population to determine the disproportionality rate for a specific racial group. The Department of Human Services was used as a reference for the calculations.
Police interaction %: Using police interaction data acquired by FOIA requests to determine the racial composition of student-police interactions in each district.
Divided By
Base population %: Using the Department of Elementary and Secondary Education’s (DESE) enrollment data per school year to determine the overall racial composition of students by district.
The visualization below allows for the comparison of disproportionality rates in school-based police interactions—both within individual districts across racial groups and between districts. Larger bubbles indicate greater disproportionality. When bubble sizes are similar across racial groups within a district, it suggests relatively equal rates of police contact. However, significant differences in bubble sizes—especially across districts—highlight where certain racial groups are more disproportionately affected.
District Disproportionality Rate
District Disproportionality Average
This visual specifically displays the average racial disproportionality rate across all districts and school years currently available. As before, the larger the bubble, the greater the disproportionality compared to other racial groups.
Understanding the proportionality of school-based police contact of racial groups against the underlying population in all 76 districts could be done by a calculation called Relative Rate index as shown below.
Numerator: Disproportionality rate of one racial group
Divided By
Denominator: Disproportionality rate of one racial group
For example, the calculated average disproportionality rate of Black students is 1.8 divided by the disproportionality rate of White students which is 0.8. This calculation shows that Black students are arrested at a rate 2.5 times higher than White students.
The visualization below displays the racial disparity ratio among Asian, White, and Black student groups. You can use the filter to view these disparities across all districts for a more granular comparison.
The visualization above provides a comparative overview of school-based police interactions—specifically arrests, citations, and summonses—across different racial groups and school districts. By examining both the frequency and type of police contact, the visual highlights disparities in how students of different racial backgrounds experience law enforcement involvement within educational settings. Users can explore patterns across districts to better understand the extent and nature of racial disparities in school policing practices, revealing where targeted interventions or policy changes may be needed.
Calculating Racial Disparity Ratio
Racial Inequalities Across Districts
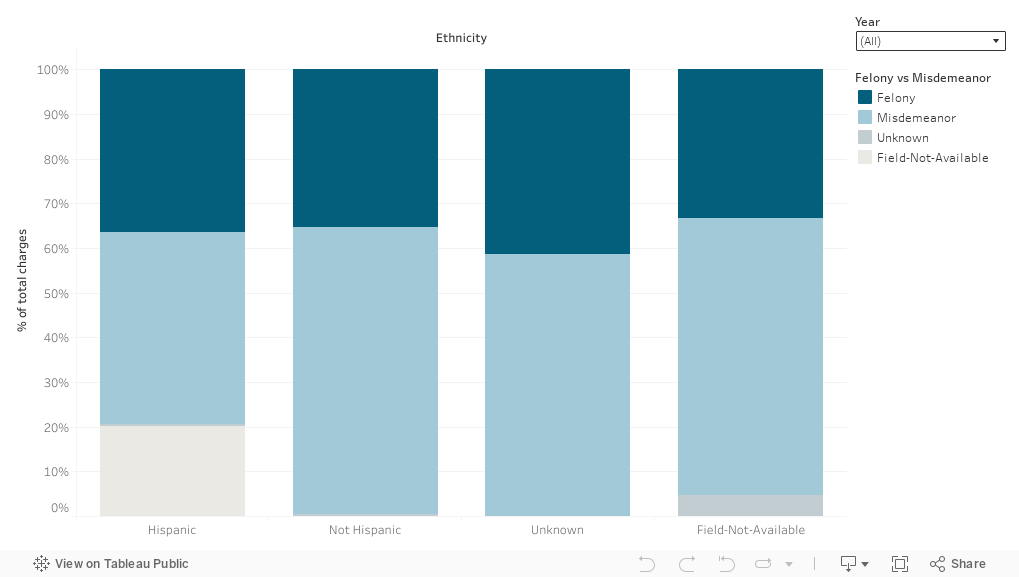
Arrests by Offense & Ethnicity 2018 - 2022
Ethnicity:
Hispanic or Latino: A person of Cuban, Mexican, Puerto Rican, South or Central American, or other Spanish culture or origin, regardless of race. The term, "Spanish origin," can be used in addition to Hispanic or Latino.
Not Hispanic or Latino
Unknown: Refers to individuals whose ethnicity was recorded as "unknown" in the data received through the FOIA request.
Field_Not_Found: Indicates that the ethnicity field was missing or not reported for the individual in the data.
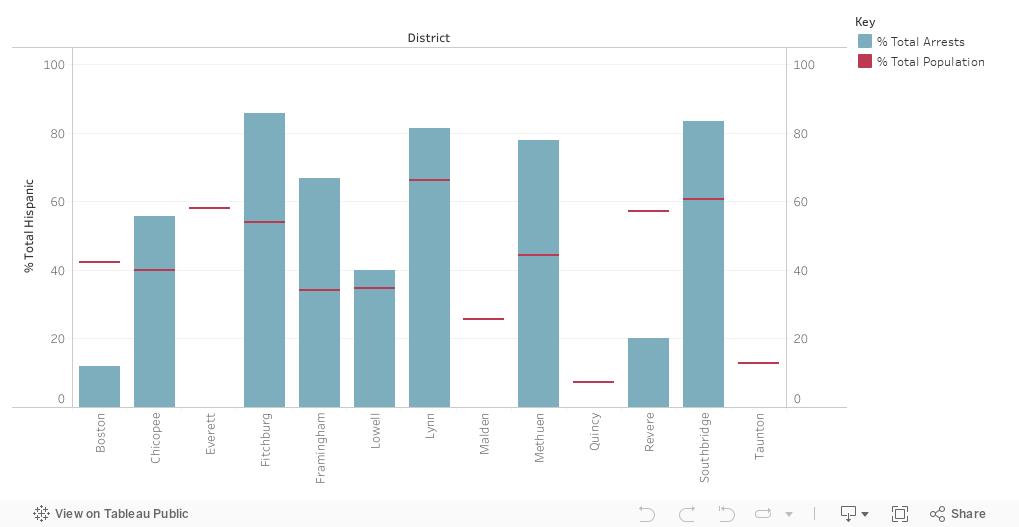
Ethnic Inequalities Across Districts
District Disproportionality Average
Ethnic Disproportionality Rates 2018-2022
Calculating the ratio of the percent of a specific racial group’s base population in comparison to their police interaction percentage. An police contact percentage is divided by the base population to determine the disproportionality rate for a specific racial group.
Arrest %: Using arrest data acquired by FOIA requests to determine the ethnic composition of student-police interactions in each district.
Divided By
Base population %: Using the Department of Elementary and Secondary Education’s (DESE) enrollment data per school year to determine the overall ethnic composition of students by district.
Based on our calculations, the following set of visualizations presents:
Ethnic disproportionality rates across all districts: Larger bubbles indicate higher levels of ethnic disparity in police interactions within a district.
Average ethnic disproportionality by year (2018–2022): This visual shows year-by-year trends across all districts for which we received complete FOIA records.
Total number of police interactions: This visualization includes filters that allow users to explore data by specific types of police contact (e.g., arrests, citations, summonses) and by charge category (felony, misdemeanor, other, or unknown).